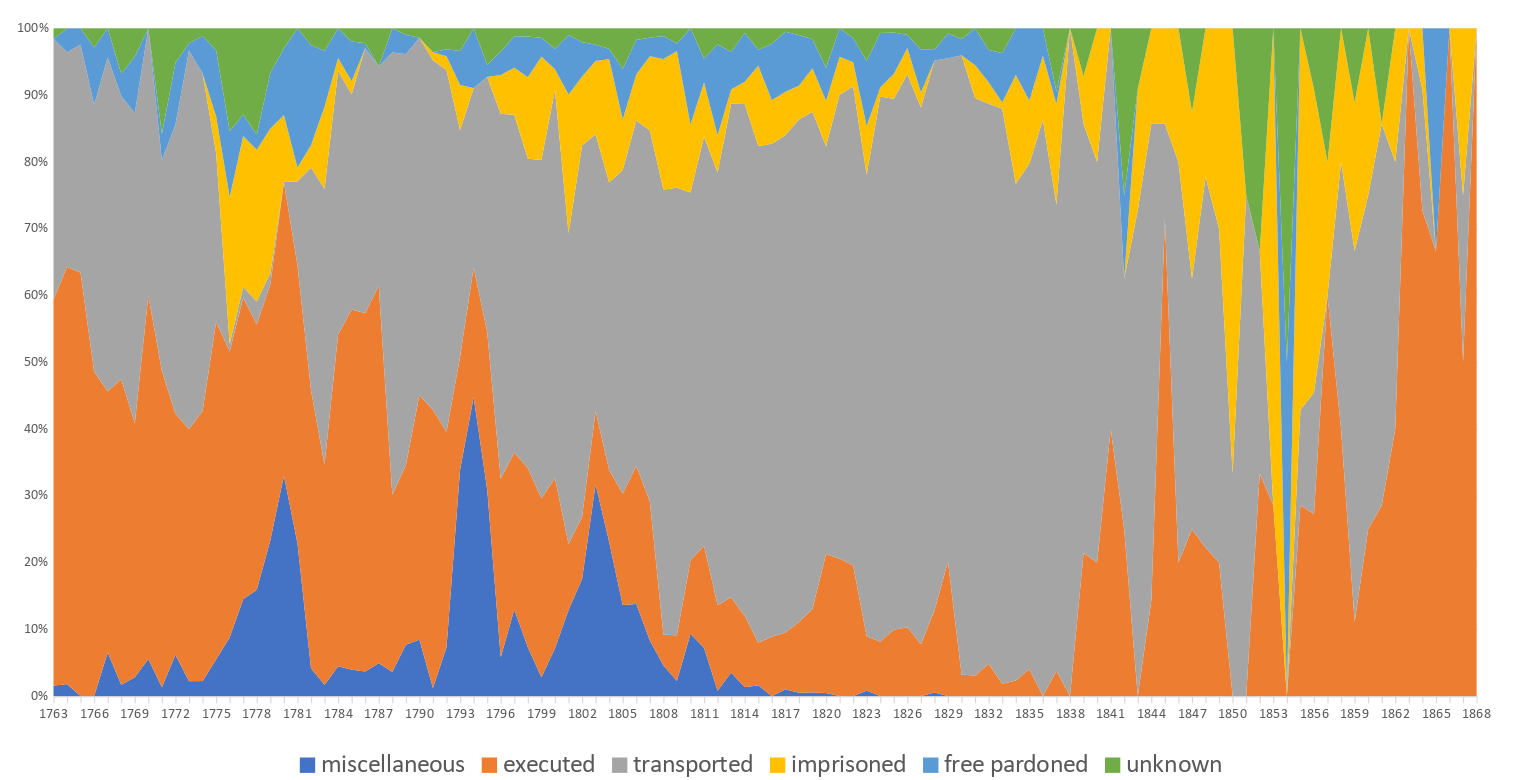
Punishment outcomes for convicts sentenced to death, 1763-1868
This stacked area chart documents the changing distribution of penal outcomes for Old Bailey convicts sentenced to death over more than a century. It is based on data downloaded from the Digital Panopticon, supplemented with additional evidence from other sources for the period from 1838. As explained in penal outcomes, only a minority of those sentenced to death were actually executed (orange), and this chart allows us to see what happened to them instead. Few received a free pardon (light blue), and instead a large number were given a conditional pardon and were transported (grey), with smaller numbers imprisoned (yellow) or given a wide range of miscellaneous sanctions (dark blue), notably service in the army or navy.
As this period witnessed the decline of capital punishment, the rise and fall of transportation, and the rise of imprisonment as punishments, the chart documents some important changes in the history of punishment. The data points are for each type of punishment for each year, which explains the sharp year-to-year variations. Following the reform of the 'Bloody Code' in the 1830s the number of offences punishable by death, and hence the number of capital sentences, declined significantly. Since only the most serious offences, notably murder, were now punishable by death, the proportion of capital convicts who were executed increased, but it also fluctuated significantly from year to year, since the number of cases was low.
Credit: Robert Shoemaker

Click to expand


