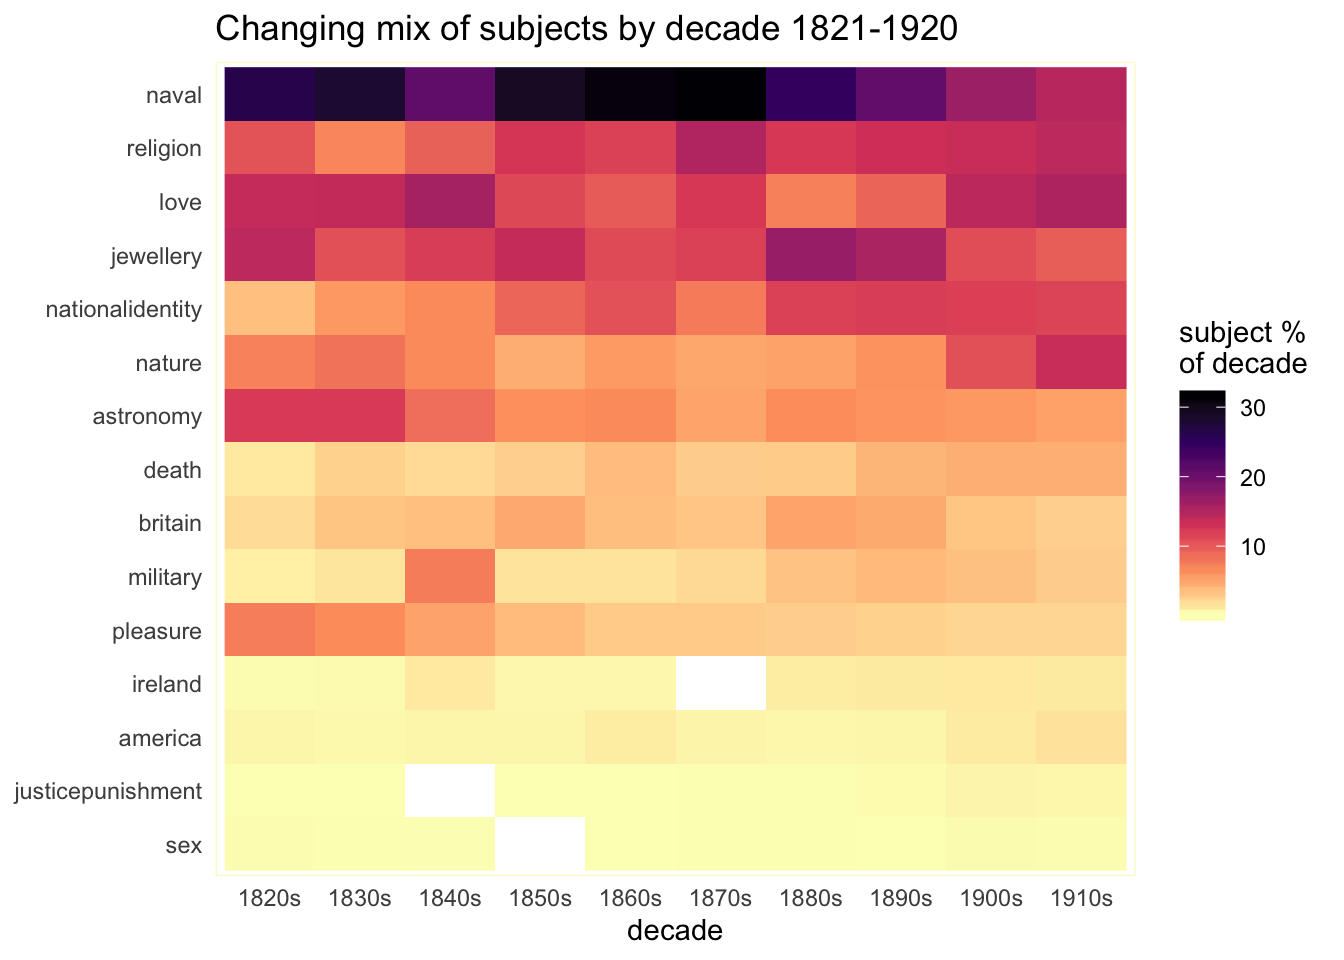
Changing mix of tattoo subjects by decade, 1821-1920
This heatmap, based on data downloaded from the Digital Panopticon, shows how the subjects of convict tattoos changed over time. For each decade (column), the distribution of tattoos by subject is indicated by colour coding, with subjects accounting for a high proportion of tattoos in that decade, such as 'naval', in darker colours, with subjects accounting for the lowest proportions (such as 'sex'), in lighter colours. The fact that the colours become less extreme and more homogenous in the columns towards the right hand side of the chart indicates that the subjects of tattoos became more evenly distributed in the later part of the period, particularly from the 1890s to 1920.
For more information about the data on which this chart is based, see the description of the tattoos datasets and the research page on convict tattoos.
Credit: Sharon Howard

Click to expand


